Thomas Chuang

Software Engineer

I build practical software products that combine AI and geospatial systems—with a focus on clean architecture, performance, and good UX.

Go Bears!

Thomas Chuang
Software Engineer 0.99
Thomas Chuang (back)
Map Enthusiast & Adventurer! 0.99

Education

University of California, Berkeley logo

University of California, Berkeley

Concurrent Enrollment StudentComputer Science

Aug 2025 – May 2026

Berkeley, CA

  • Relevant: CS 61C (Machine Structures), CS 162 (Operating Systems), Data 100 (Data Science)
  • Planned: CS 164 (Compilers), CS 161 (Computer Security)
National Chengchi University logo

National Chengchi University

Dual Bachelor of Arts in Risk Management & Insurance and Land EconomicsMinor in Management Information Systems

Sep 2020 – Jun 2026

Taipei, Taiwan

  • GPA: 3.86/4.00 • CS Field GPA: 3.98/4.00
  • Relevant: Data Structures (A+), Algorithms (A+), DBMS (A+), Software Engineering (A+)
Peking University logo

Peking University

Exchange Student

Feb 2024 – Jun 2024

Beijing, China

  • Relevant: Deep Learning Models and Applications, Data Visualization

Professional Experience

Ultralytics logo

Ultralytics

Associate Software Engineer

Aug 2024 – Present

Remote

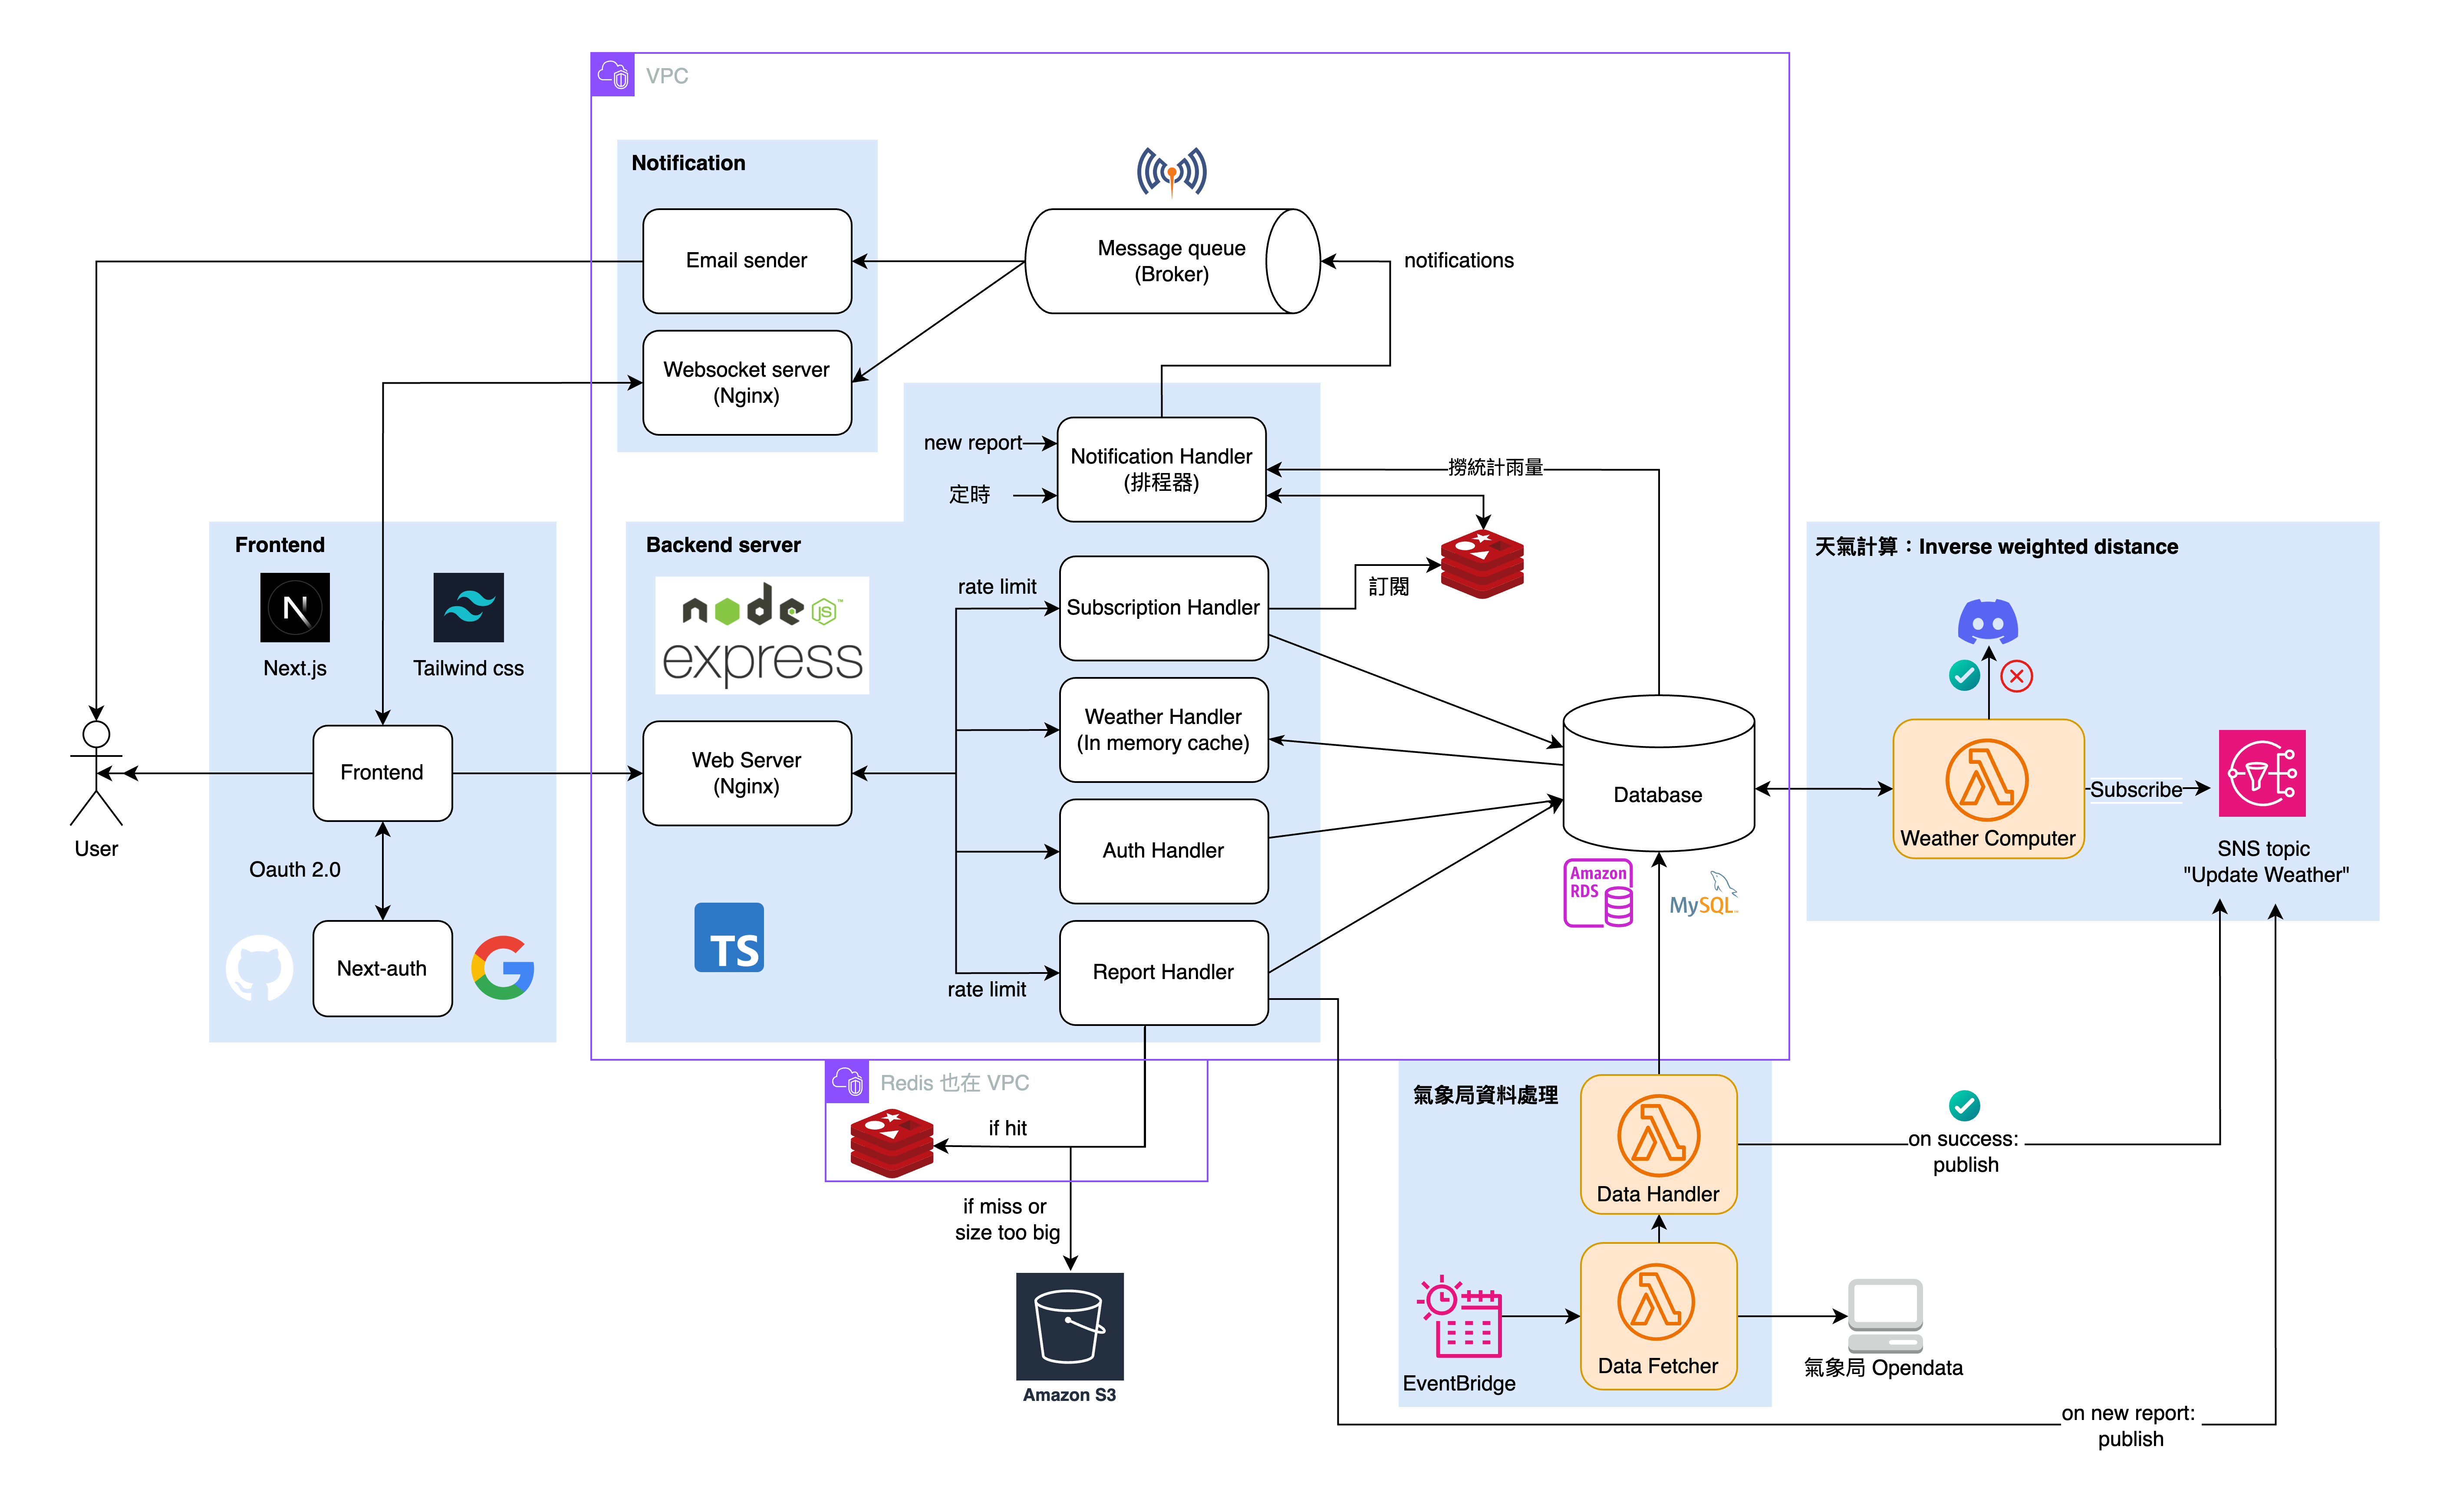
  • Built real-time collaboration with FastAPI WebSockets + Redis for concurrent multi-user editing (sub-100ms perceived latency).
  • Designed conflict-safe state updates using optimistic concurrency (ETags) to preserve integrity under race conditions.
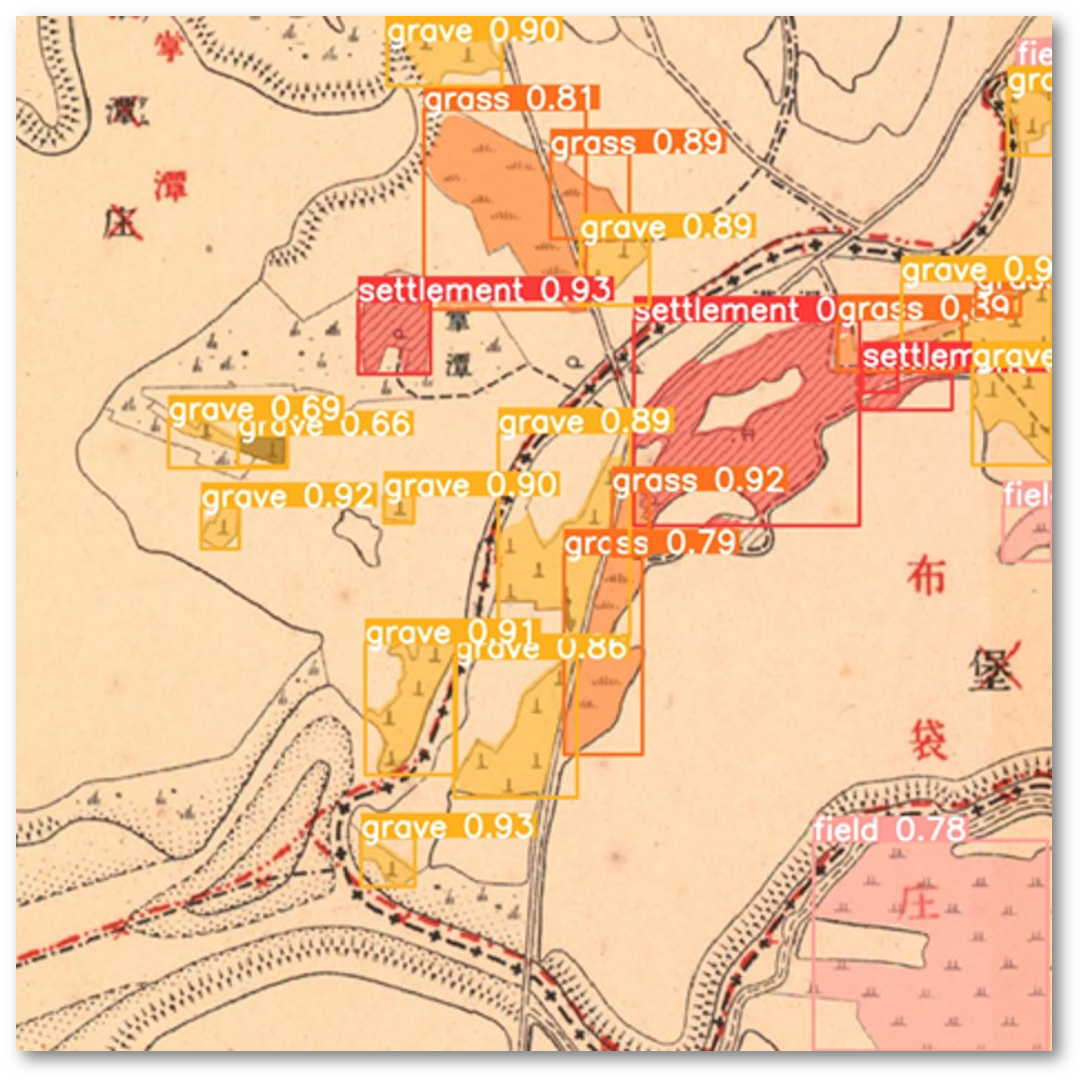
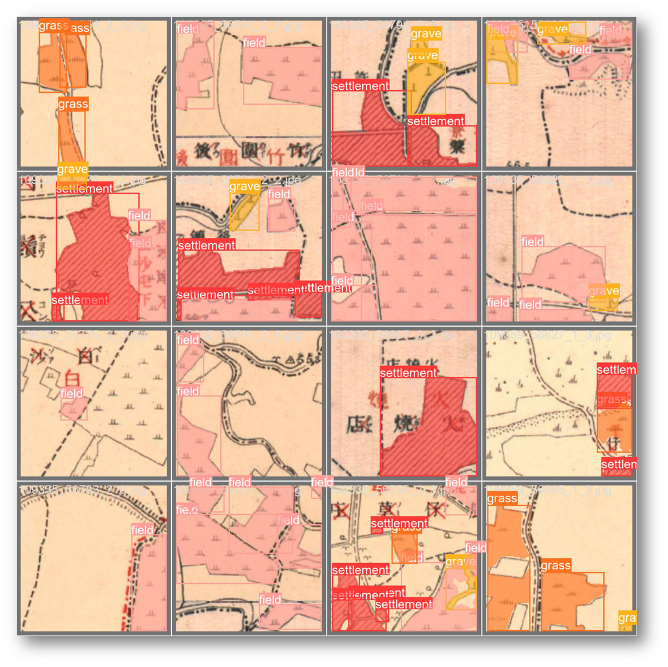
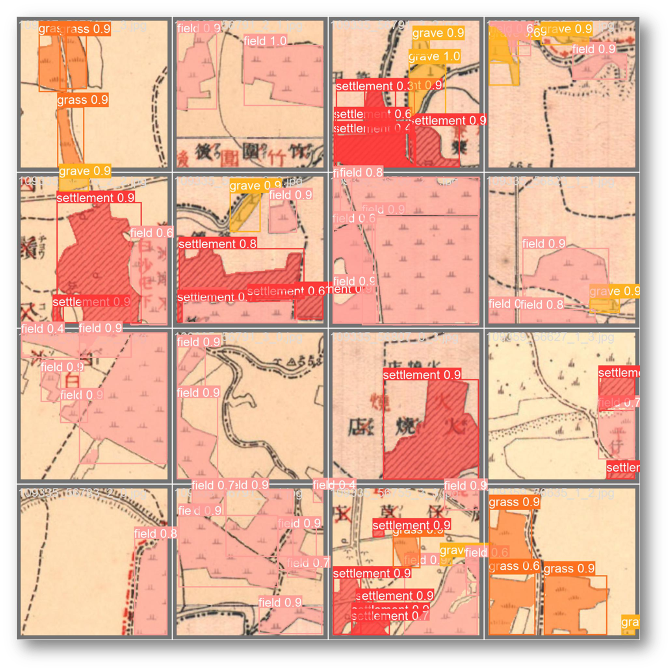
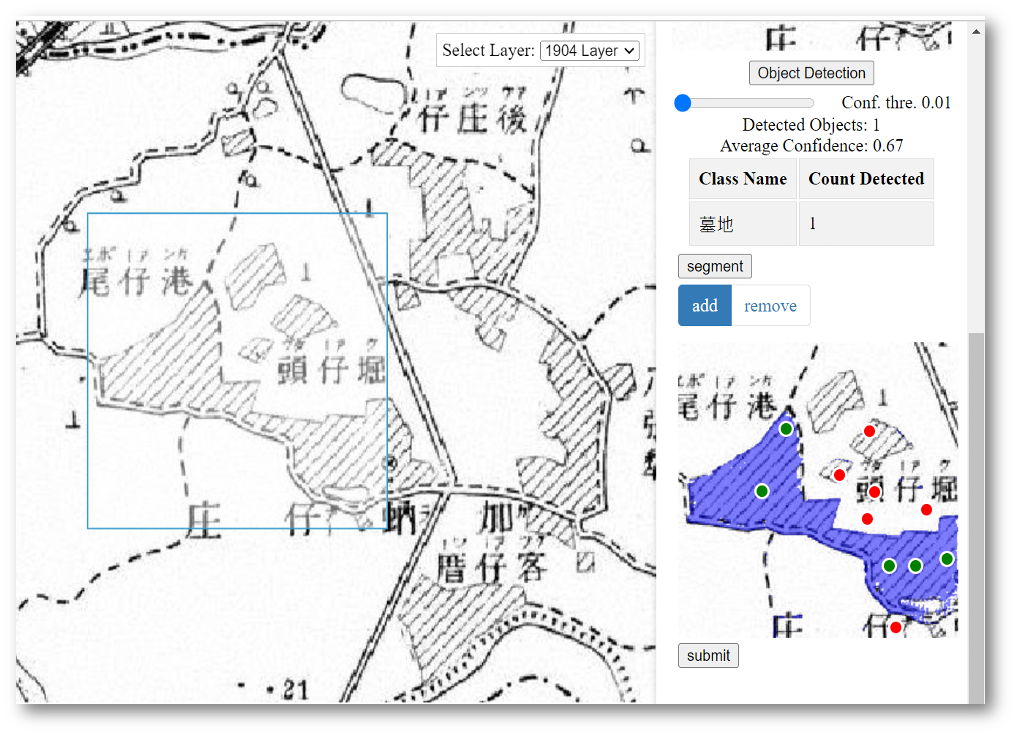
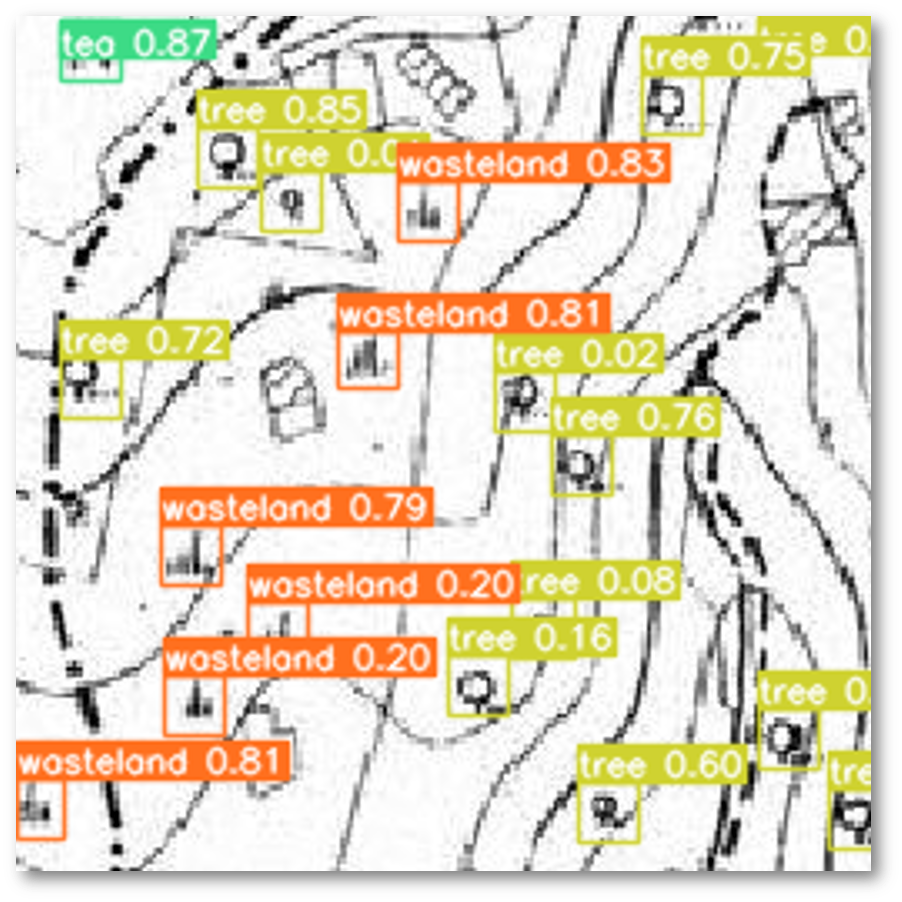
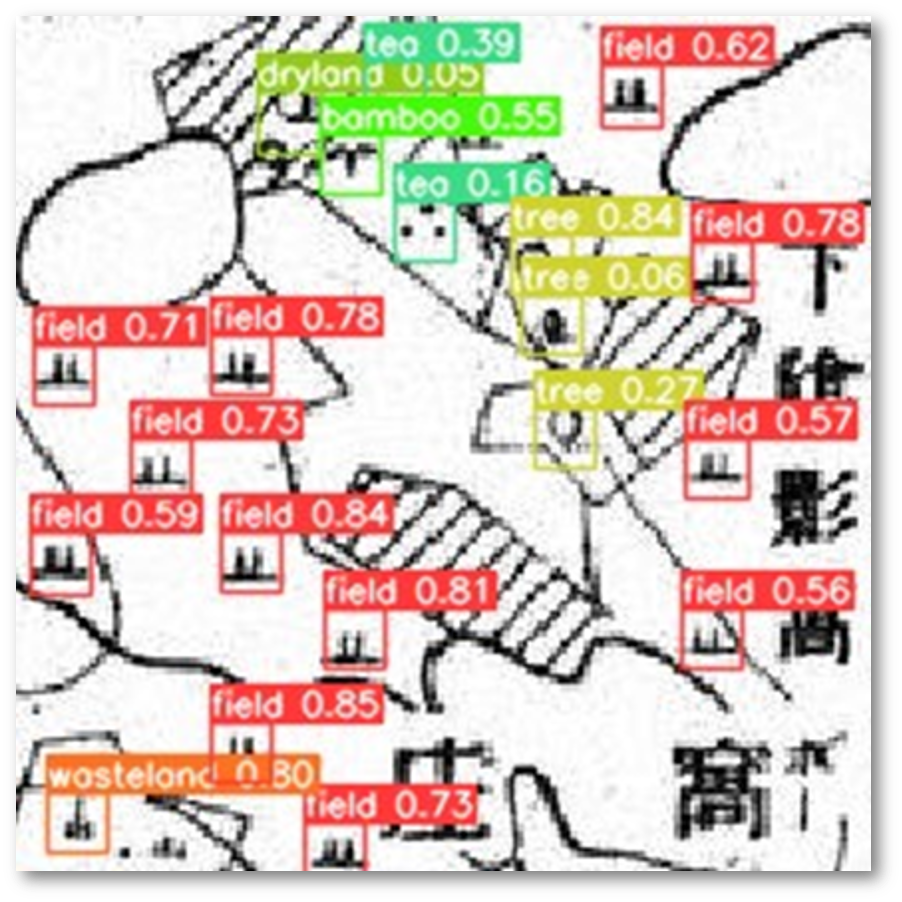
  • Integrated Segment Anything Model (SAM) for auto-labeling, reducing manual annotation time by ~40% on vision datasets.
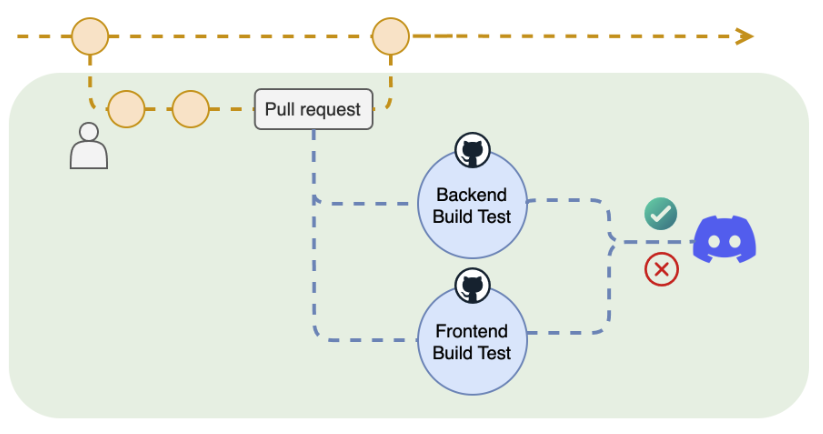
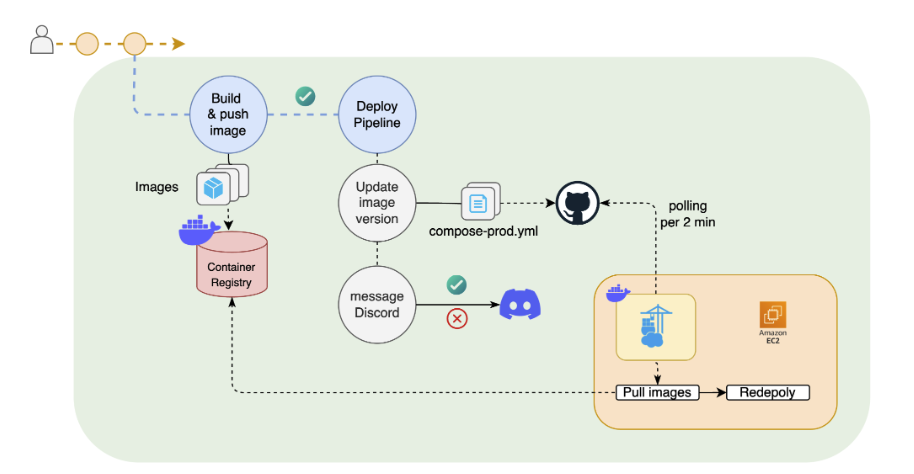
  • Orchestrated CI/CD workflows for the open-source repo (51.8k stars), improving release reliability for global users.
Esri R&D Center logo

Esri R&D Center

Product Engineer Intern

Apr 2024 – Aug 2024

Beijing, China

  • Improved ArcGIS Earth 3D interaction by profiling rendering bottlenecks and reducing frame drops.
  • Prototyped a GPT-4o geospatial assistant to automate SQL-style queries and map generation from natural language.
  • Strengthened product stability through regression testing and code review practices for enterprise releases.
Academia Sinica logo

Academia Sinica

Undergraduate Researcher

Jul 2023 – Dec 2024

Taipei, Taiwan

  • Researched automated feature extraction for historical maps by combining YOLOv5 with Segment Anything (SAM).
  • Built a full-stack vectorization & verification system (Flask, PostgreSQL, Docker, OpenLayers).

Projects

Selected work — research-driven, visual, and interactive.

Historical Map of Taiwan Based on GeoAI
YOLOv5 + SAM (2023) · YOLOv8 Instance Segmentation (2024)

GeoAI pipeline for Taiwan historical map digitalization: started with YOLOv5-based feature recognition integrated with Segment Anything for faster digitization, then upgraded to YOLOv8 instance segmentation for improved vectorization quality.

  • Labeled 8 land-use classes and synthesized training data via random crop-composition to improve generalization.
  • Upgraded from object detection to instance segmentation, improving the quality of map feature extraction.
  • Result visualizations include detection, labeling, and prediction comparisons; packaged as a PDF report.
Detection result

Detection

Label visualization

Label

Prediction visualization

Prediction

System interface

System interface

Result comparison 1

Result (1)

Result comparison 2

Result (2)

Pmap — The Map for Precipitation 🌦️
Crowdsourced Reports + CWA Data · Subscription & Notifications · Cloud-Native

Pmap combines crowdsourced rain reports with official CWA weather data to estimate real-time precipitation more accurately. Users can report rain conditions (with photos), subscribe to fixed locations or regions, and receive in-app + email notifications based on schedules, new reports, or rainfall thresholds.

  • Fusion of public rain reports + CWA data to compute more accurate precipitation conditions.
  • Rain reporting flow with photos + real-time map experience (Leaflet) and dark mode.
  • Subscription & notification system: region-based new reports, scheduled rain updates, and threshold-based alerts (in-app + email).
Pmap demo

Pmap demo: reporting, map interaction, subscriptions, notifications

System architecture diagram

System architecture (frontend / backend / notification / cloud)

CI pipeline diagram

CI pipeline (GitHub Actions + Docker build/test)

CD pipeline diagram

CD pipeline (deployment workflow / Portainer)

Pmap map UI screenshot

Real-time precipitation map (CWA + public reports)

Subscription UI screenshot 1

Subscribe to fixed locations / regions

Subscription UI screenshot 2

Configure schedules & thresholds

Notifications screenshot

In-app notifications + email alerts

Taiwan Public Bicycle System Analysis
Time Series + Interactive Mapping (2021) · Spatio-temporal Insights (2024)

Built a data pipeline to track YouBike station dynamics over time: periodic scraping of open data, pandas time-series storage, matplotlib visualizations embedded into Folium popups, and later spatio-temporal analysis (DBSCAN, MRT transfer patterns) with Random Forest factor study.

  • Automated scraping + longitudinal station dataset (pandas) for trend analysis over time.
  • Interactive Folium map with per-station matplotlib time-series popups for exploration.
  • 2024 analysis: DBSCAN station development, last-mile + MRT transfer issues, Random Forest feature impact; recognized in National Storymaps Competition.
Space-time cube visualization

Space-time cube for spatio-temporal dynamics

MRT transfer / bike relationship analysis

Last-mile & MRT transfer relationship insights

Visualization of riding route (OD)

Riding route visualization (OD patterns)

Random Forest independent variables (1)

Random Forest feature set (1)

Random Forest independent variables (2)

Random Forest feature set (2)

YouBike data pipeline flow (GIF)

Flow visualization of YouBike data

Folium popup with embedded time-series plot

Folium popup embedding matplotlib time series

Heat map visualization

Heat map of station activity / demand patterns

Taiwan Convenience Store Analysis
Spatial Pattern (2021) · Spatio-temporal Prediction (2023)

Two-part study of convenience store competition in Taipei: (1) Average Nearest Neighbor (ANN) to test Hotelling-style spatial competition across five chains; (2) spatio-temporal prediction pipeline (Suitability → Space-Time Cube → MGWR) with statistical validation.

  • ANN-based spatial pattern analysis for five major convenience store chains (Taipei metro).
  • Spatio-temporal prediction built with suitability analysis, space-time cube, and MGWR; validated statistically.
  • Recognized in the National Storymaps Competition; detailed Medium write-up linked.
Suitability model

Suitability model outputs

MGWR outputs

MGWR analysis outputs

Workflow

Validation workflow

ANN results

Average Nearest Neighbor (ANN) results

ANN stats table

ANN statistics by chain

Relationships map

Collaboration & competition relationships

Technical Skills

Python
TypeScript
JavaScript
C / C++
R
Rust
FastAPI
Flask
Node.js
React
Docker
Kubernetes
Redis
Kafka
Jenkins
AWS
GCP
GitHub
GitHub Actions
Git
Next.js
Nuxt.js
Vue
Vercel
Postman
SAM
Milvus
PyTorch
OpenLayers
ArcGIS

Contributions Calendar

@chuang091